Cyclones
Climate change is not expected to increase the total number of tropical cyclones. However, a warmer climate increases the potential for storms that form to bring stronger winds and heavier rainfall.
Selected-year evidence.
The latest timeline year is summarised here in plain language.
Annual emissions across four income groups
Regional conditions are shown as a connected story from climate drivers to ecosystem impacts.
Global GHG emissions 40.80 Gt CO₂e; air temperature anomaly +0.2°C vs the 1971–2000 mean.
Sea-surface temperature +0.17°C; rainfall anomaly -4.7 mm; sea-level anomaly +3.3 cm; reported affected persons N/A.
Samoa crop yield: 6.07 t/ha.
0.81; lower values mean greater extinction pressure.
Baseline year: compare this year with the highlighted anomaly years on the timeline.
Ocean anomaly (°C)
Warmer seas stress reefs and fisheries.
Air anomaly (°C)
Heat pressure reaches land and ocean.
Rainfall anomaly (mm)
Too little or too much rain disrupts islands.
People directly affected
Aggregate yield (t/ha)
Declined 33% since 2000
1 = No species at risk
Select a year to explore what happened.
What happened this year
Climate change is not expected to increase the total number of tropical cyclones. However, a warmer climate increases the potential for storms that form to bring stronger winds and heavier rainfall.
El Niño is a natural ocean-atmosphere pattern. Small shifts in tropical Pacific sea-surface temperature can reorganize circulation and weather around the world. Warming is likely to alter El Niño-related impacts, although scientists have lower confidence about changes in event frequency or intensity.
Earthquakes are tectonic events, not climate hazards. Rising seas and extreme rainfall can still worsen related consequences, including coastal inundation from tsunamis and rainfall-triggered landslides.
Evidence boundary: these mechanisms provide hazard context; they do not attribute the selected year's reported disaster total to climate change.
A species-level example, not annual timeline evidence, showing how climate pressure can compound an already fragile extinction risk.
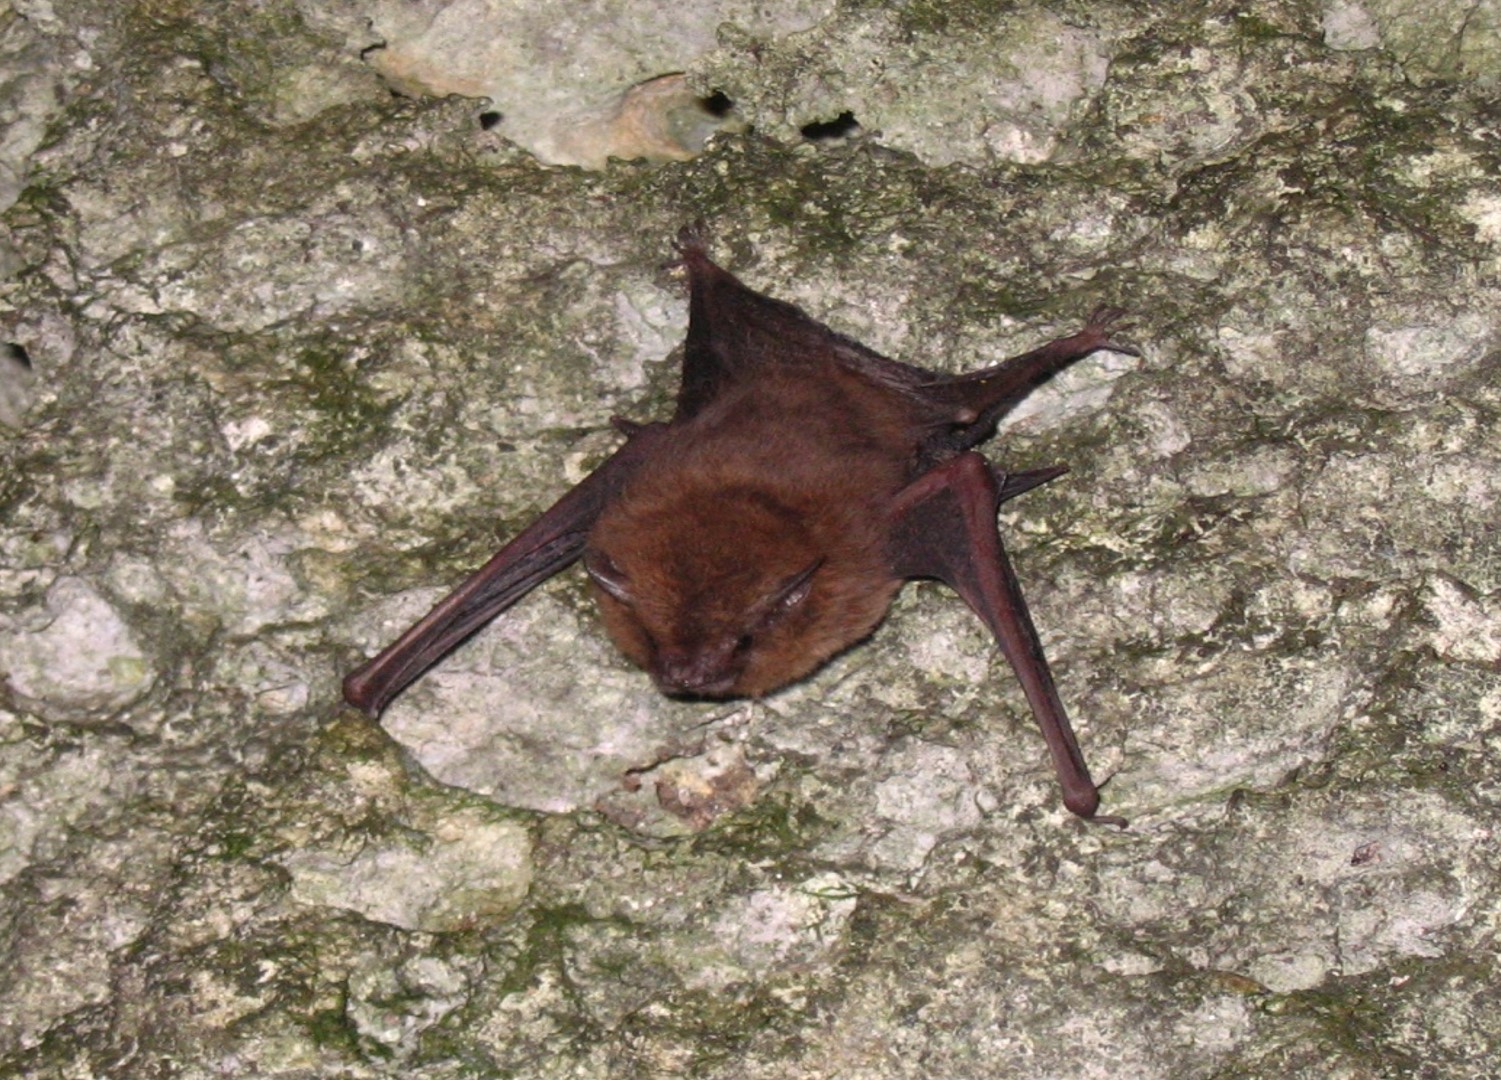
Emballonura semicaudata
The IUCN assessment identifies ongoing storms and flooding. Recovery evidence also highlights extreme rain, storm surge and sea-level rise.
Many colonies depend on coastal caves and nearby forest. Flooded roosts and stripped forest can remove shelter and insect-foraging habitat at the same time.
Habitat loss, invasive predators and disturbance already weaken the species. A severe storm can then affect a large share of a colony in one event.
Species example, not index arithmetic. This external case explains a plausible climate-to-extinction pathway. It does not show that this bat is included in, or drives, the dashboard's regional aggregate Red List Index.
The drop is observed in the official aggregate yield series. Climate stress is credible context, but this chart cannot attribute the change to temperature alone.
Every later available year remains below the 2014 level. That makes 2015 an important level shift in the series, not just a one-year dip.
Pacific agriculture guidance identifies El Niño dry seasons as a threat to Samoa's rain-fed traditional crops, particularly drought-sensitive taro.
Warm conditions can compound moisture stress by increasing evaporation and plant water demand, especially when soils retain little water.
The 2015 annual precipitation anomaly was slightly positive, but an annual mean can combine very dry growing stages with very wet months. Timing matters to crops.
Climate context, not causal attribution. The dashboard pairs aggregate annual crop yield with annual precipitation. It does not include crop-specific temperature, monthly growing-stage rainfall, cyclone damage, pests, land use, or management. These sources make heat and drought plausible pressures, but they do not prove that temperature caused the 2015 break.
Official Landsat island outlines and horizontal shoreline-change rates around Tuvalu's capital atoll.
The map's m/year values measure the shoreline moving horizontally. They are not a vertical rise in water level and should not be subtracted from land elevation.
The attached file contains total CO₂ emissions by income group. Pacific nations together contribute less than 0.05% of global emissions, with Tuvalu contributing only 20,000 of the 54 billion tonnes of greenhouse gases emitted in 2024.
These annual panels overlay the Pacific regional datasets by year. Scrub the timeline or select a key event below it to see the evidence, context, and limits of each relationship.
The line shows population-weighted greenhouse-gas emissions per Pacific resident.
Demand and the energy source together shape emissions pressure.
The Pacific share is small, but every source adds to the global total.
Annual Pacific anomalies reflect global warming plus regional variability.
How to read the arrows: they show the physical pathway, not proof that one year's Pacific energy use caused that same year's temperature anomaly. Warming responds to accumulated global emissions.
Positive sea-surface temperature anomalies indicate conditions above the reference baseline.
Samoa's aggregate crop yield viewed beside its annual precipitation anomaly.